The State of Divorce in the US from 1960 to 2018
What’s the Real Divorce Rate in the US?
Most of us have heard the statistic, ‘50% of all marriages end in divorce’.
But, is this really true? Sure, a lot of people go through a divorce in the US, but do half of all U.S. marriages end in divorce?
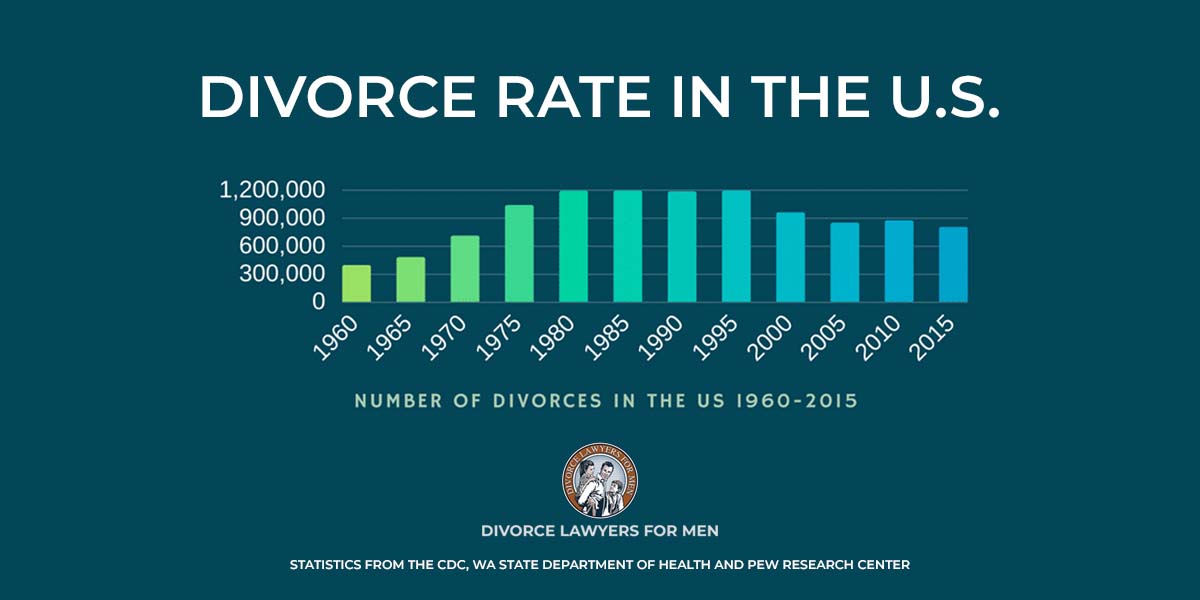
The short answer is no, luckily, half of all marriages are not headed towards divorce. The divorce rate in the US has actually been declining since 2000.
According to Paul Amato, a top divorce rate researcher, believes that between 42% and 45% of marriages in the US will end in divorce when all of these different measurements are taken into account.
So, 50% of marriages don’t end in divorce as previously reported. It’s more likely now that 42%-45% of marriages will end in divorce in the US. The main factor that has caused this decrease is that marriage rates have declined. Fewer people in the U.S. are getting married, opting for co-habitation or remaining single.
Measuring the national divorce rate has always been a challenge and will continue to be a challenge. But, the good news is that half of all marriages don’t end in divorce as previously reported.
So, if 50% of marriages in the US don’t end in divorce like everyone thinks, how did people get the idea that 50% of all marriages end in divorce?
Some Fascinating Statistics About Divorce in the US:

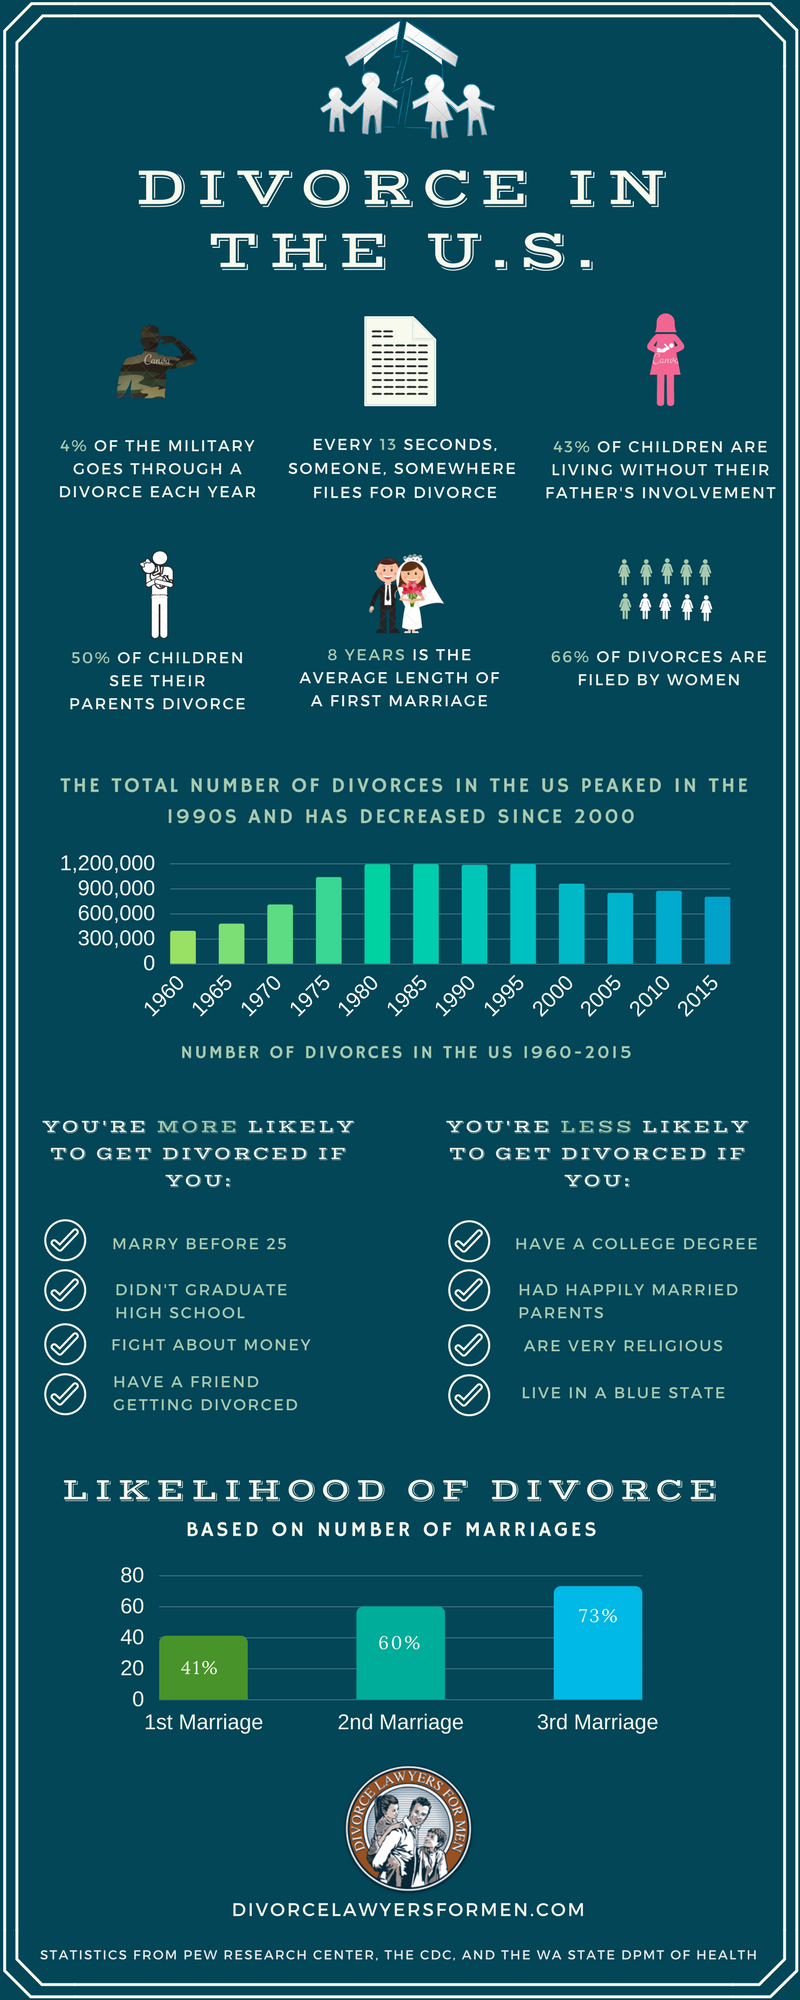
Starting the in 1970s, there was a huge increase in the number of divorces filed in the U.S. In 1969 there were 639,000 divorces filed in the U.S. In 1979, there were 1,181,000 divorces filed in the U.S. In 10 years, the number of divorces filed in the U.S. almost doubled. The numbers leveled out around the 1990s and declined starting in the 2000s.
The often-referenced ‘50% of all marriages end in divorce’ statistic likely comes from the time in the 1970s when that statistic was calculated. Throughout the 1990’s, the number of divorces in the U.S. was quite high, so this statistic still made sense up until the 2000’s when the number of divorces filed in the U.S. decreased.
This statistic is calculated by taking the number of marriages each year and dividing that number by the number of divorces each year. In 1990, there were 2.4 Million marriages and nearly 1.2 Million divorces in the US. By this flawed logic, 2.4/1.2 equals 50%. Therefore, it was widely reported that the divorce rate was 50%.
The issue with this measurement, however, is that the couples who marry in any given year don’t necessarily divorce in that same year. For example, all 2.4 Million couples who married in 1990 did not also divorce in 1990.
Family researchers typically study the divorce rate in the U.S. by looking at people born in a particular year and their individual divorce rates; but, the only way to know how many of those people’s marriages ended in divorce is to follow them until they go through a divorce. This is pretty tough to do on a large scale, so a lot of family researchers dispute the current divorce rate.
One reason there is so much controversy over the current divorce rate is that there are 4 different ways to measure it, and each measurement looks at a different part of divorce:
- The “crude divorce rate” – based on the number of divorces for every 1000 people in the population.
- The “refined divorce rate” – based on the number of divorces for every 1000 married women.
- The “cohort rate” or probability a marriage will end in divorce – based on several variables including education, age, socio-economic status, previous marriages, etc.
- The percentage of adults in the U.S. that have ever been divorced, which changes yearly.
One measurement alone cannot predict the current rate of divorce in the US. Instead, family researchers calculate these rates from year to year and make educated predictions based on the results.
Here are some other interesting statistics about divorce in the US:
- Every 13 Seconds, someone, somewhere, files for divorce.
- 66% of divorces are filed by women
- 4% of people in the military file for divorce each year
- 50% of children in the US will see their parents divorce in their lifetime
- 43% of children in the US are living without their father involved in their lives
- 41% of first marriages end in divorce
- 60% of second marriages end in divorce
- 73% of third marriages end in divorce
- The average first marriage lasts 8 years
Here are a few statistics about divorce in Washington State:
- There were 25,437 divorces in Washington in 2019
- The divorce rate in Washington was 5.9 people per 1000 in 1990
- The divorce rate in Washington was 3.5 people per 1000 in 2018
Click Here to Learn More about Divorce Facts and Statistics in Washington State.
You’re more likely to get divorced if:
- Your parents went through a divorce
- You fight about money with your spouse
- You didn’t graduate high school
- You marry before age 25
- You smoke cigarettes, but your spouse doesn’t
- You have a friend going through a divorce
You’re less likely to get divorced if:
- You’re very religious
- You have a college degree
- You live in a blue state (good news for those in Washington!)
- You had happily married parents
- You marry after age 25
- You watch romantic movies with your spouse
Statistics from the CDC, WA State Department of Health and Pew Research Center. Get in touch with us if you’re looking for a family law attorney in Vancouver, WA.


